
The STARANISO Server
Anisotropy of the Diffraction Limit
and
Bayesian Estimation of Structure Amplitudes


| The STARANISO ServerAnisotropy of the Diffraction Limit
| 
|
Contributed by Valerie Pye.
Bowler, M.W., Nurizzo, D., Barrett, R., Beteva, A., Bodin, M.,
Caserotto, H., Delageniere, S., Dobias, F., Flot, D., Giraud, T. et
al. (2015). "MASSIF-1: a beamline dedicated to the fully automatic
characterization and data collection from crystals of biological
macromolecules." J. Synchrotron Rad. 22, 1540-1547.
Svensson, O., Malbet-Monaco, S., Popov, A., Nurizzo, D. and Bowler,
M.W. (2015). "Fully automatic characterization and data collection from
crystals of biological macromolecules." Acta Crystallogr.
D71, 1757-1767.
Svensson, O., Gilski, M., Nurizzo, D. and Bowler, M.W. (2018).
"Multi-position data collection and dynamic beam sizing: recent
improvements to the automatic data-collection algorithms on
MASSIF-1." Acta Crystallogr. D74, in press.
Warne, T., Serrano-Vega, M.J., Baker, J.G., Moukhametzianov, R.,
Edwards, P.C., Henderson, R., Leslie, A.G.W., Tate, C.G. and Schertler,
G.F.X. (2008). "Structure of a β1-adrenergic G-protein-coupled
receptor." Nature 454, 486.
Contributed by Bernhard Rupp (Hofkristallamt): Rupp B. (2018) "Against Method: Table 1 — Cui Bono?".
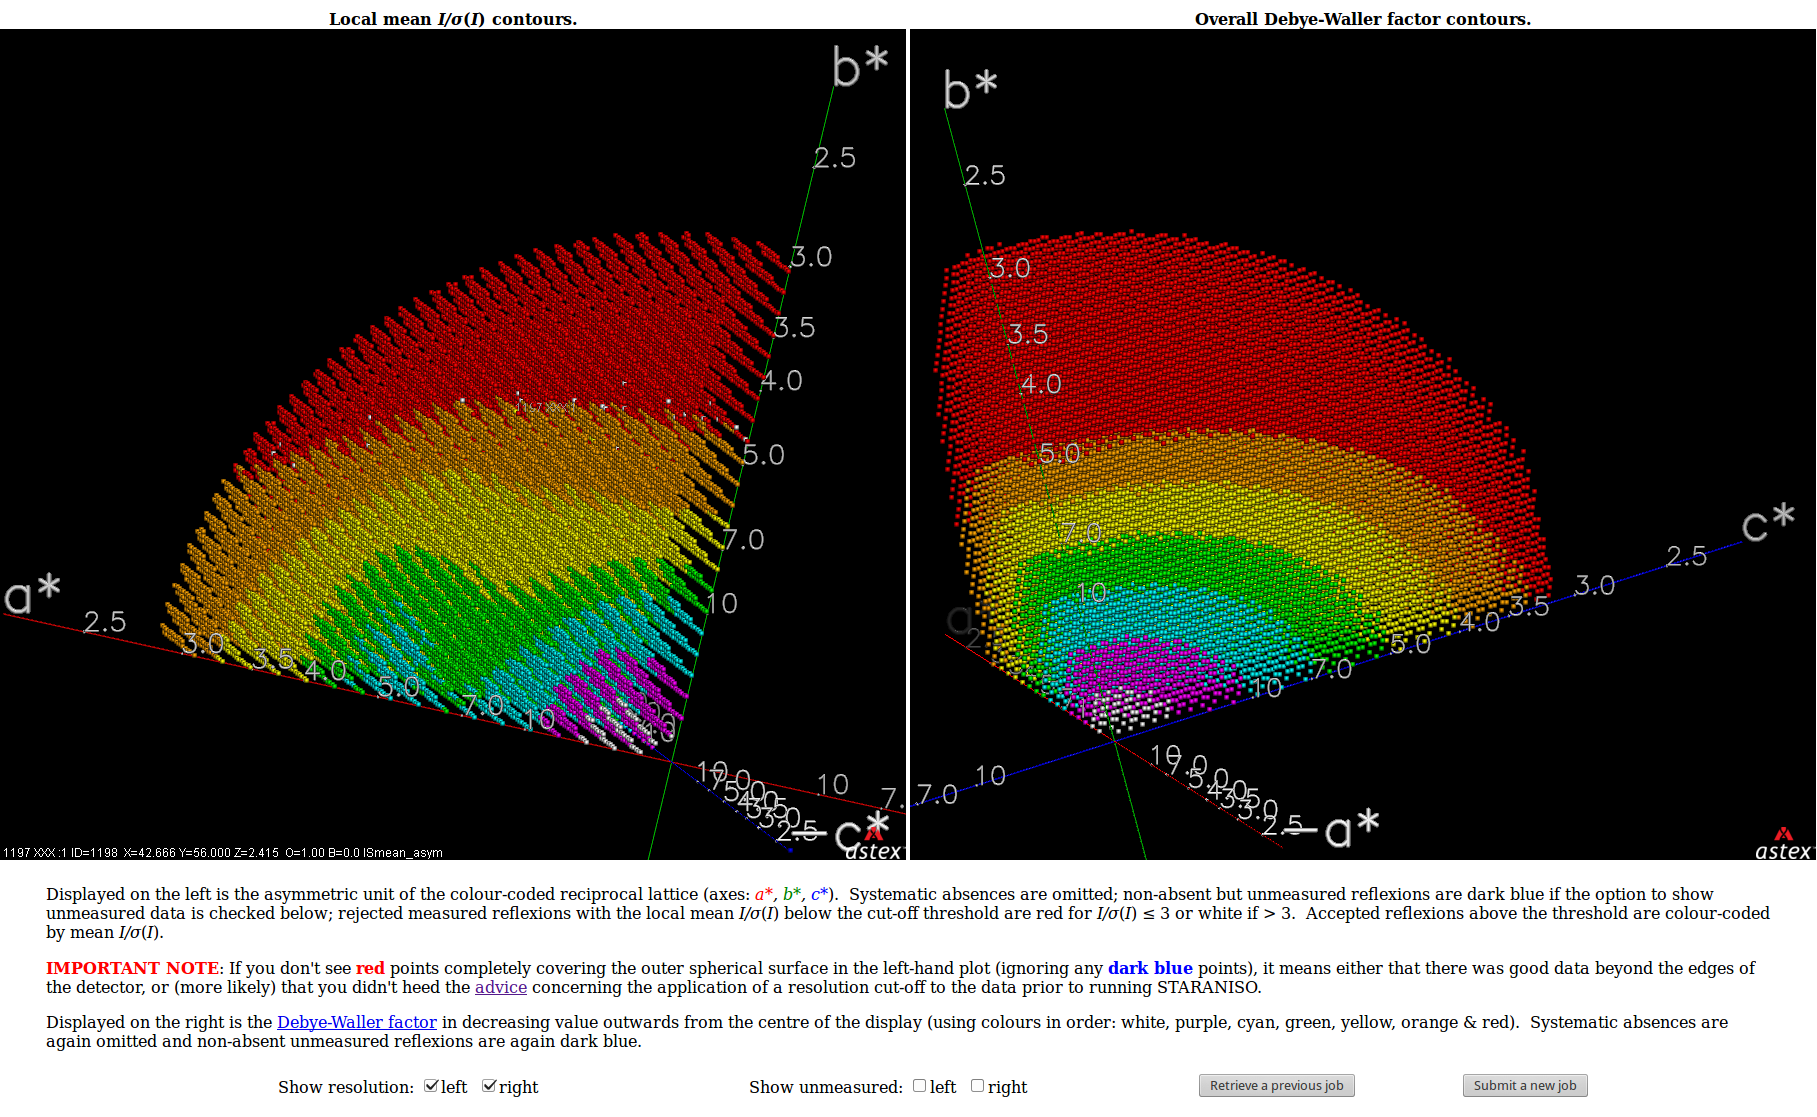
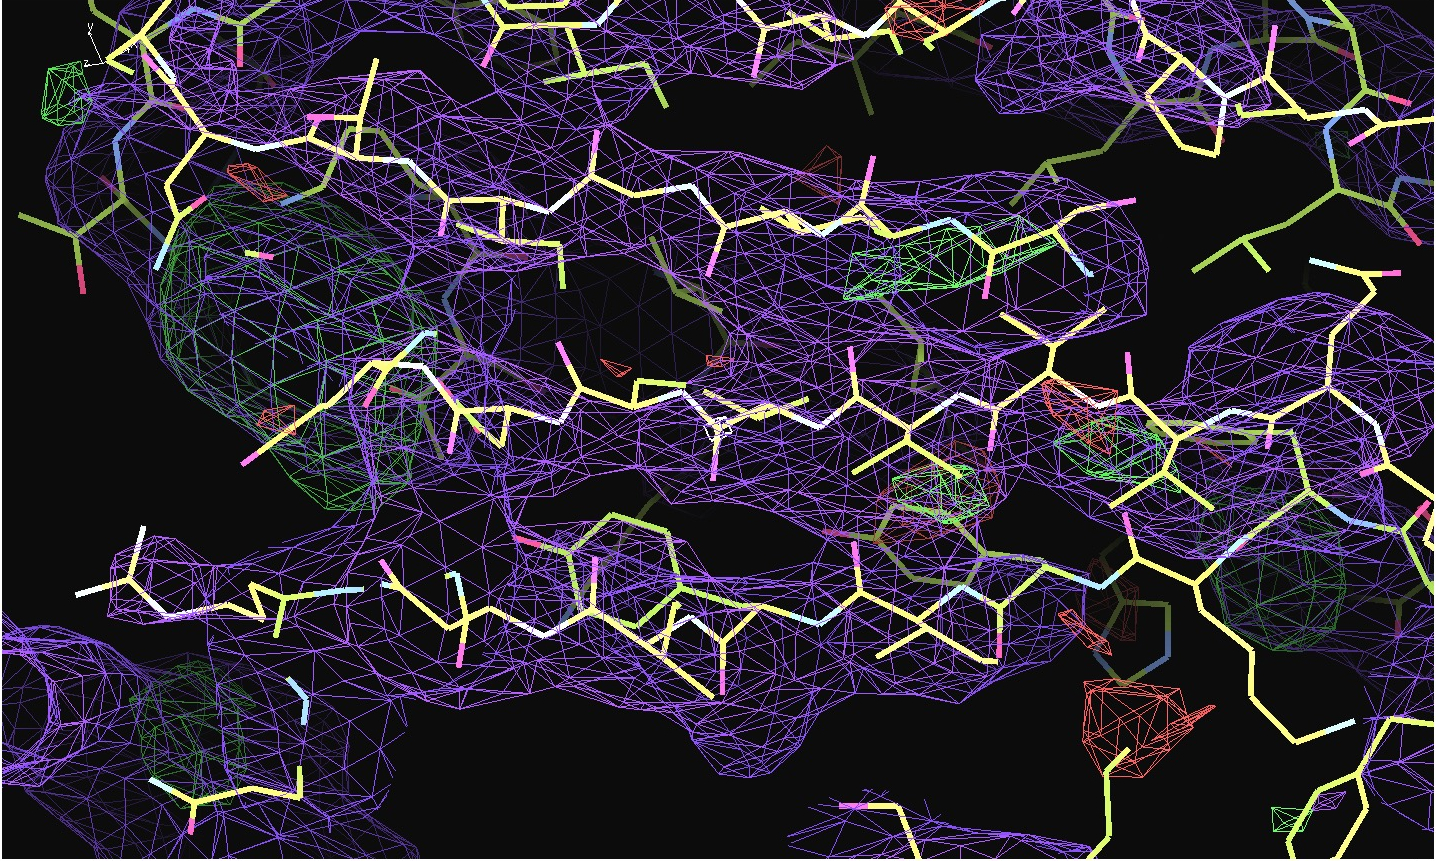
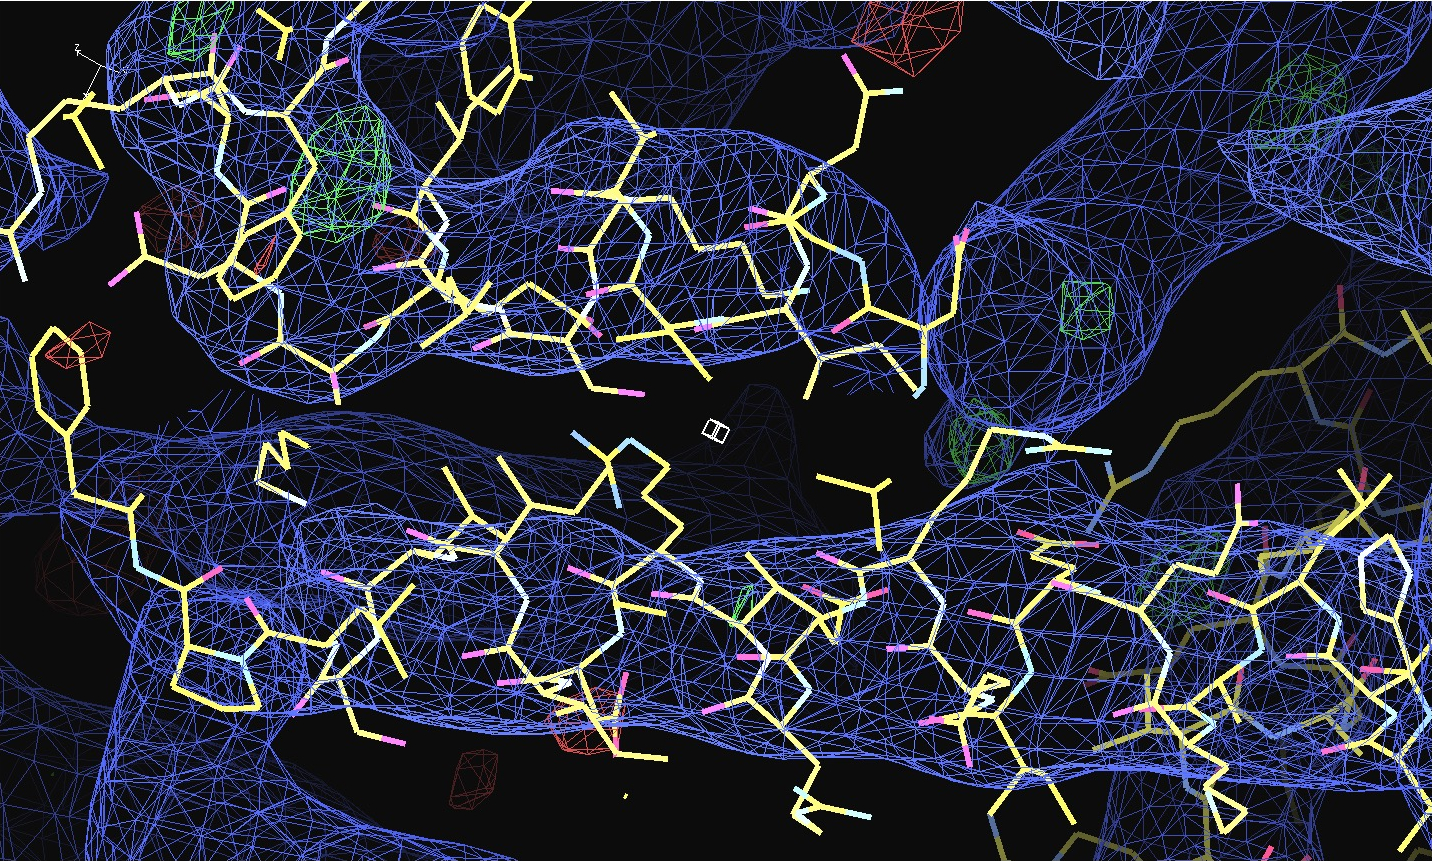
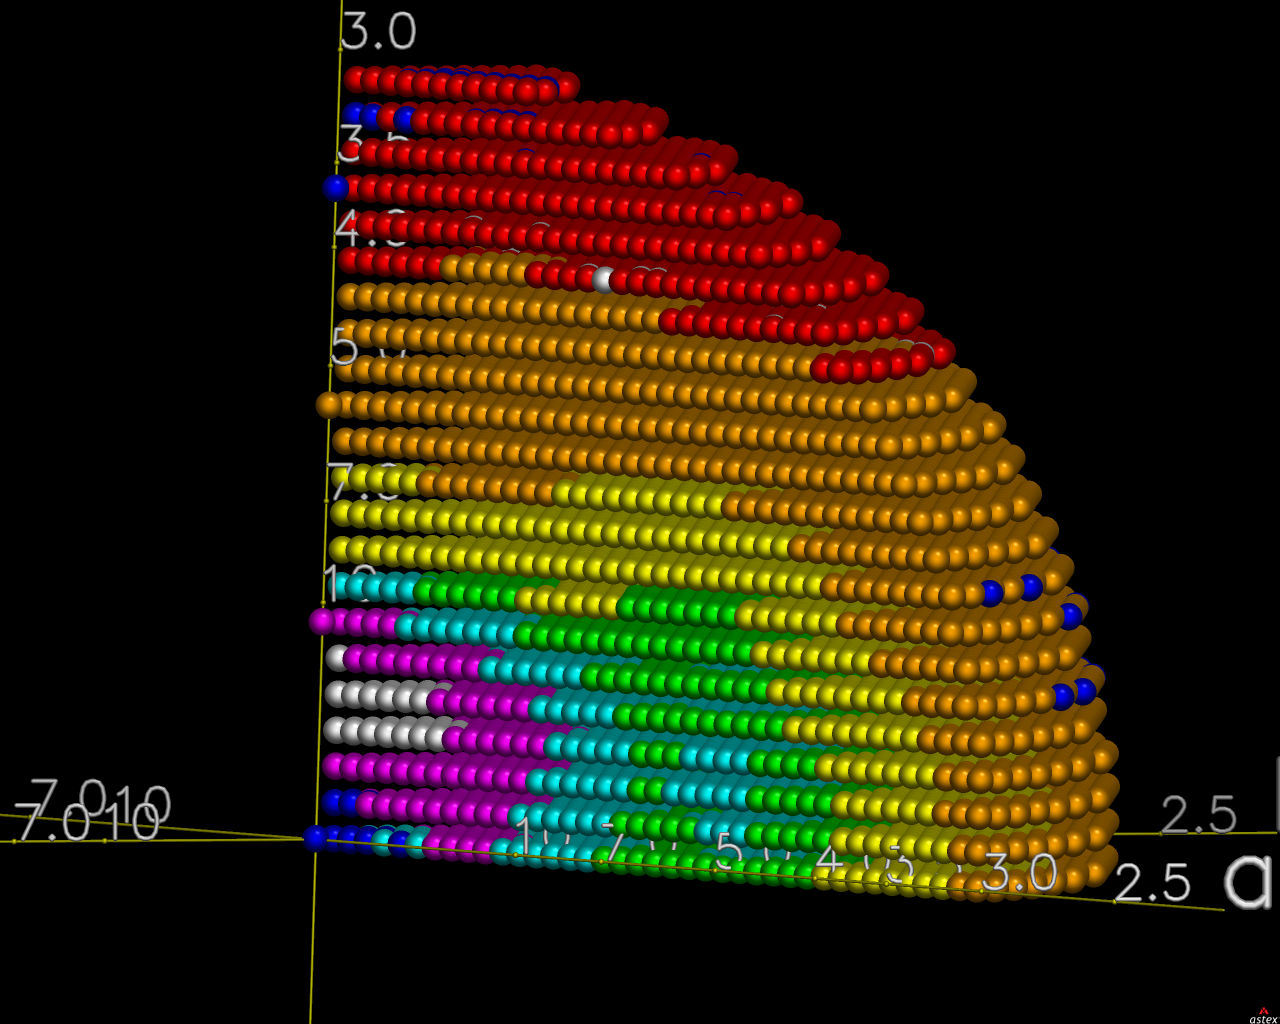
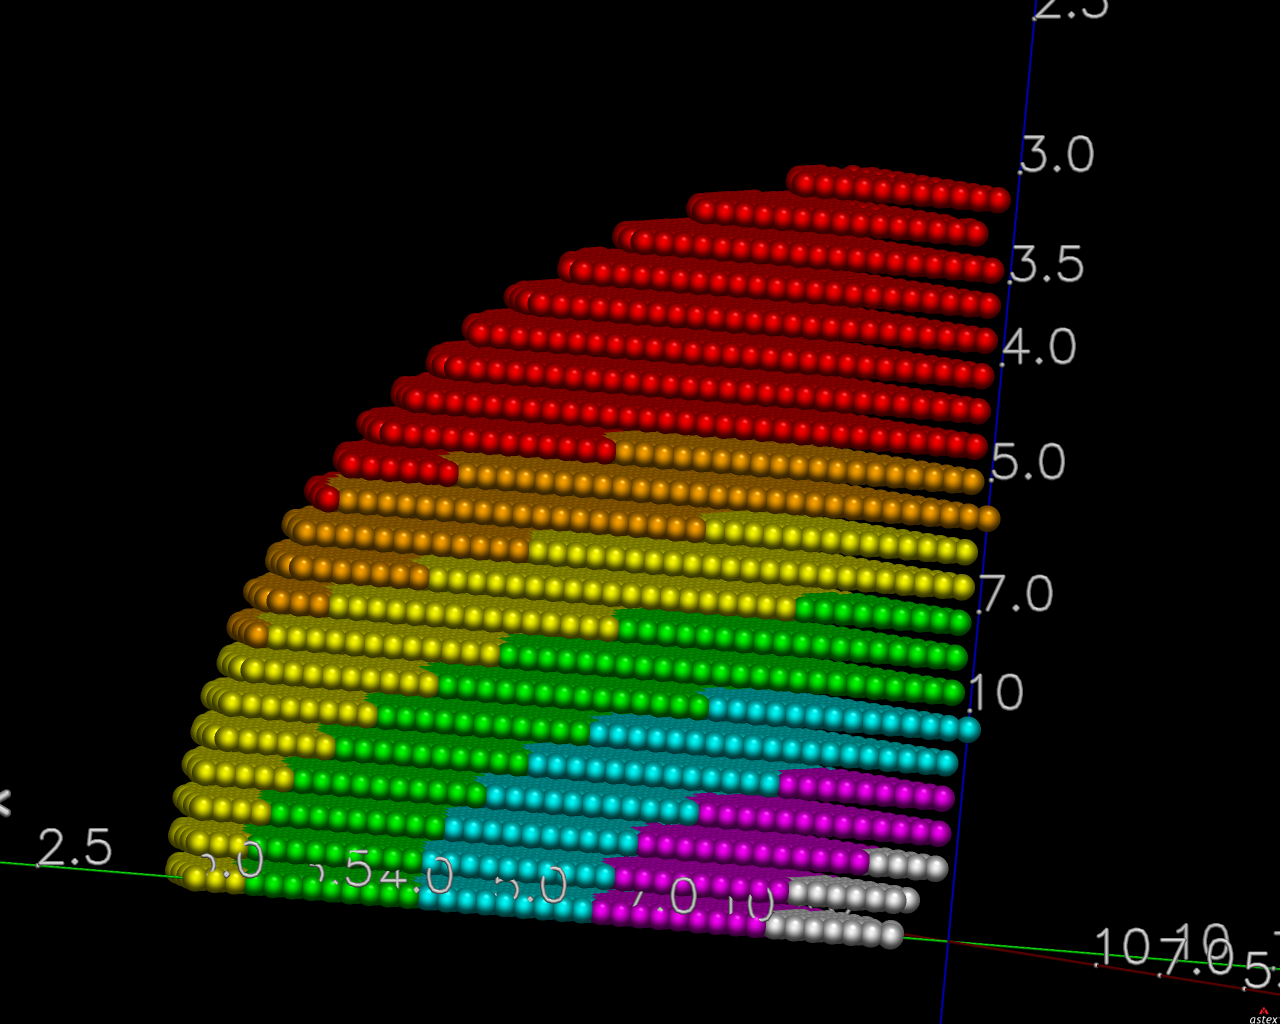
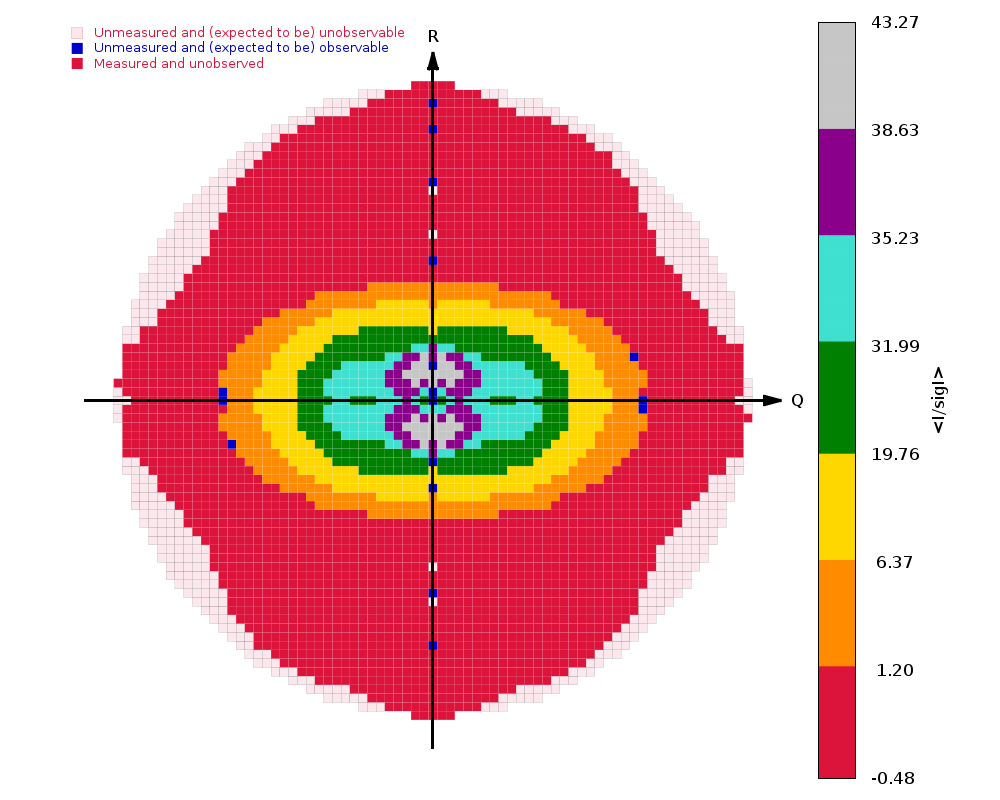
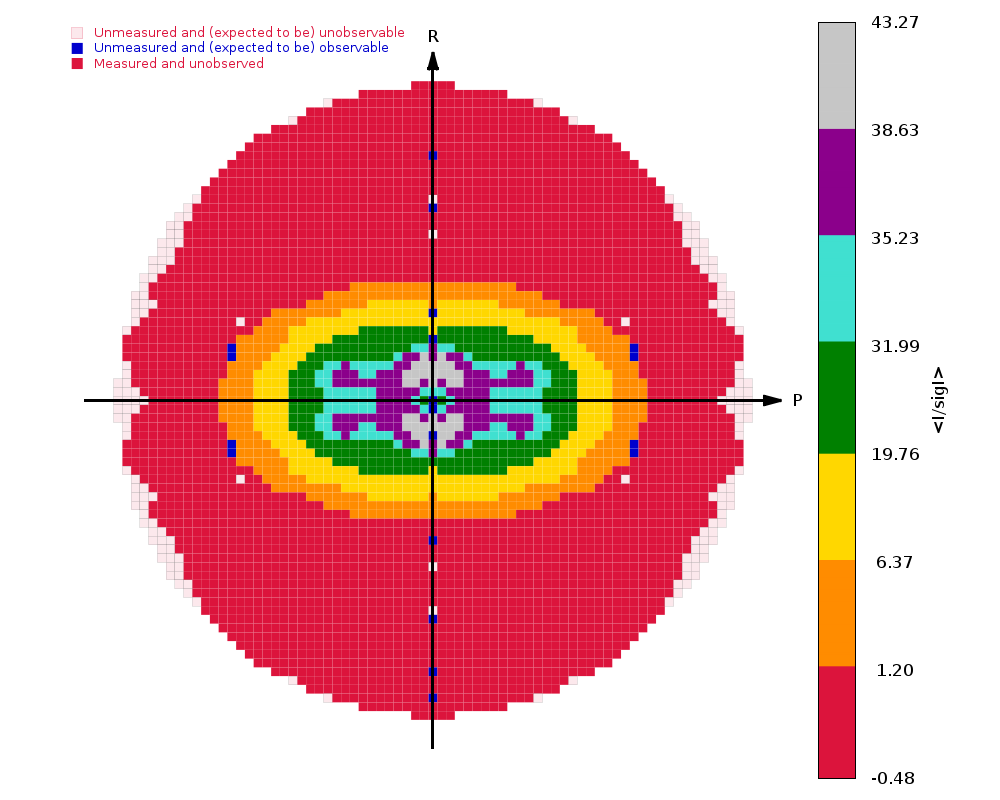
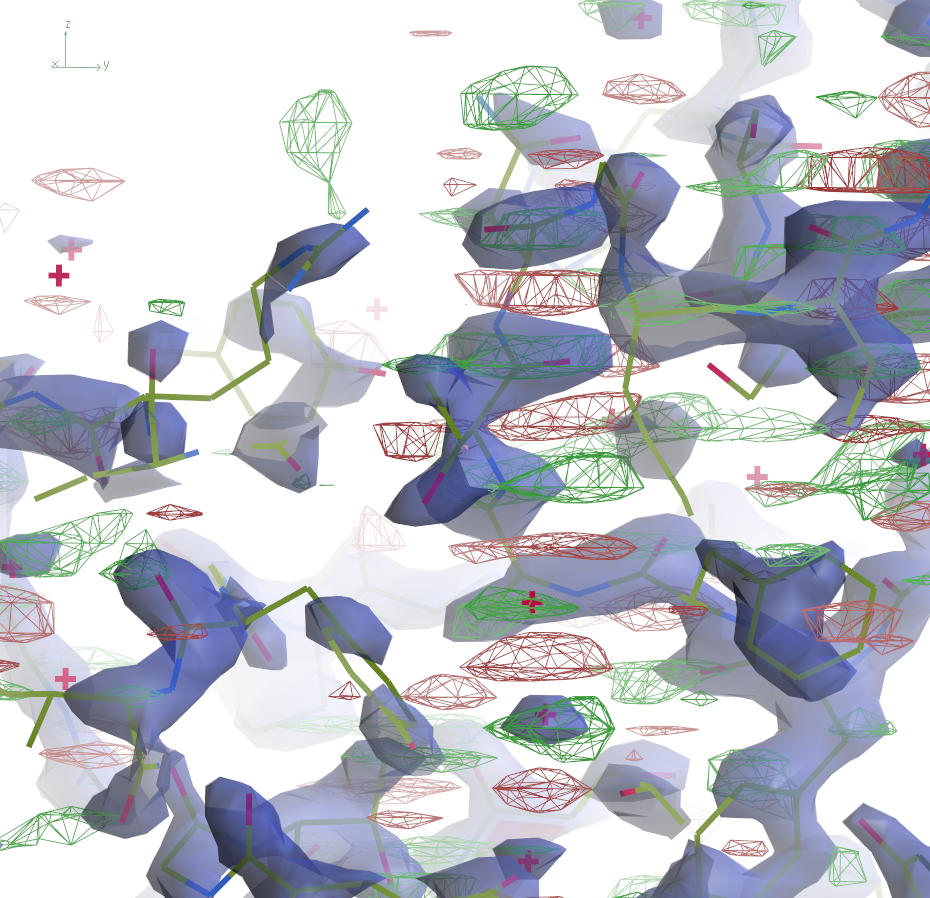
| Shown below are views of the intensity data in 3D reciprocal space provided by STARANISO and displayed by OpenAstexViewer as interactive Java applets embedded in the web page. On the left is the colour-coded distribution of the local mean value of I/σ(I), and on the right is shown the Debye-Waller factor. These indicate substantial anisotropy, as evidenced by significantly differing diffraction limits along the a*, b* and c* axes (space group: C2221). | Shown below are the electron-density maps before (mauve) and after (blue) invocation of STARANISO. Both maps are contoured at 1.5 RMSD, corresponding to absolute contour levels of 0.1125Å-3 for the original map and 0.1602Å-3 for the map after treatment of the intensity data by STARANISO. The Rwork/Rfree values after the two BUSTER refinements that produced these maps are 0.3406/0.3626 and 0.3109/0.3264 respectively. |
|
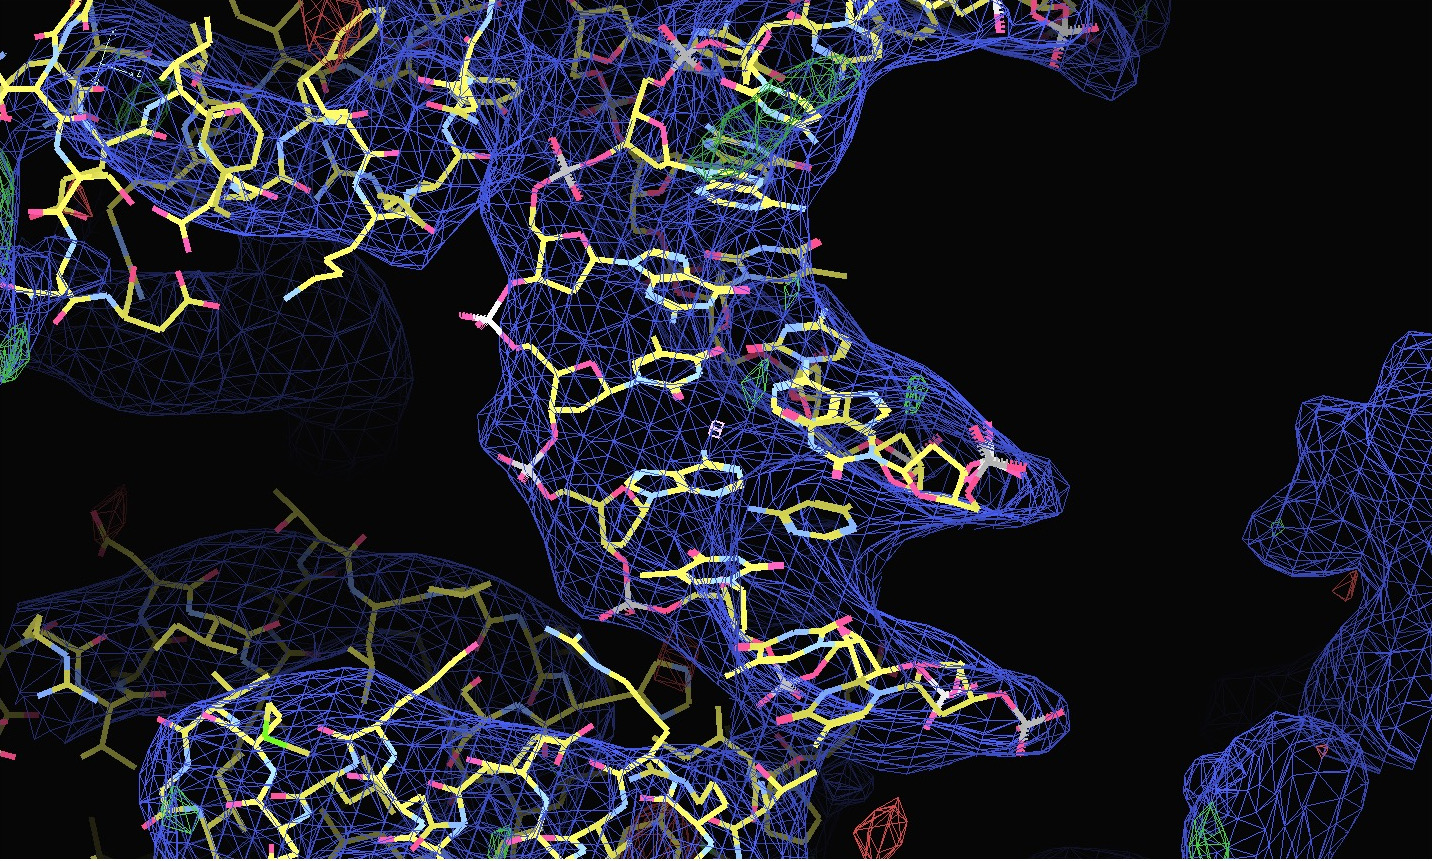
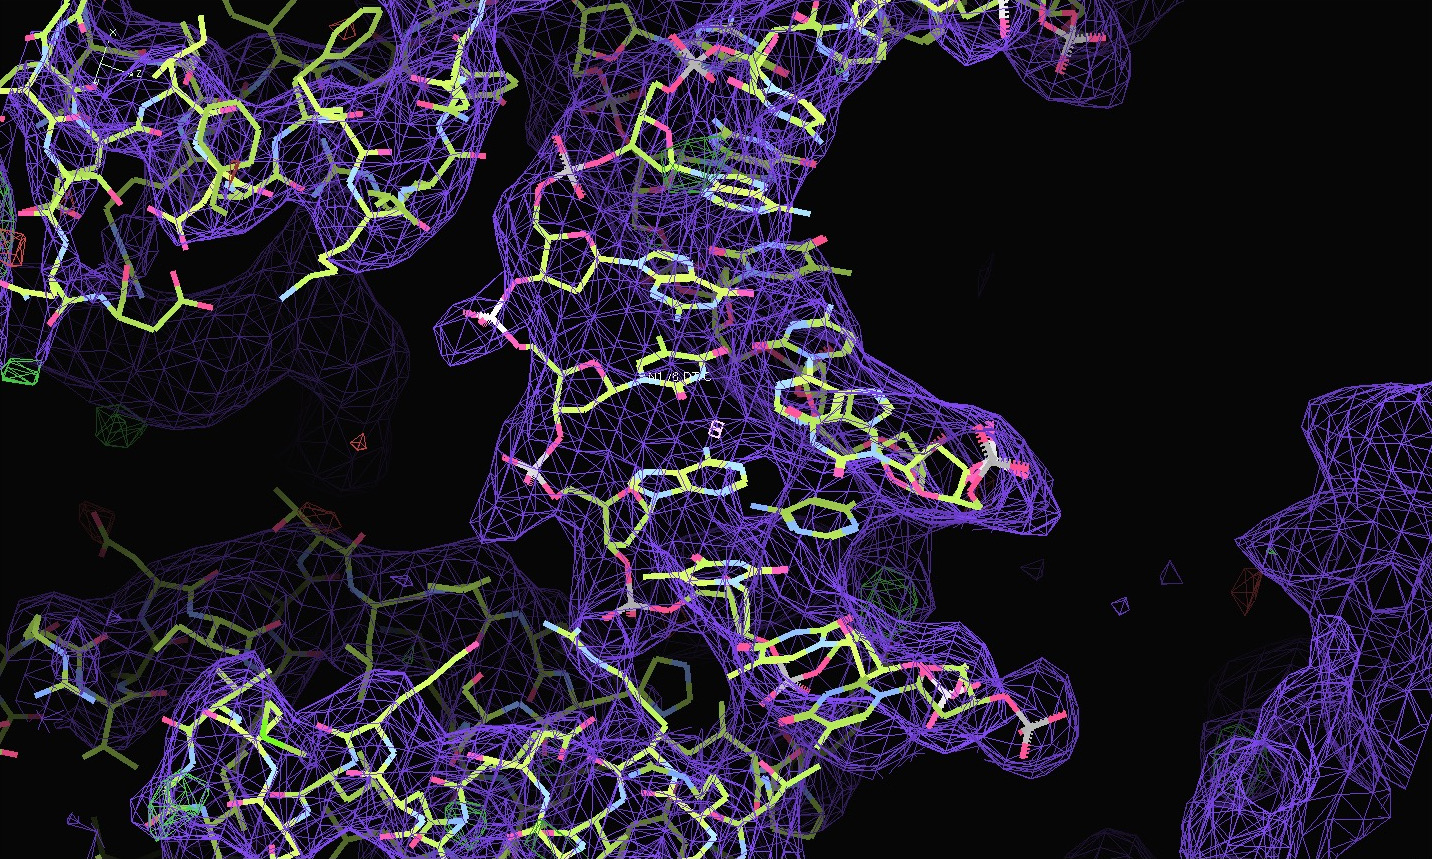
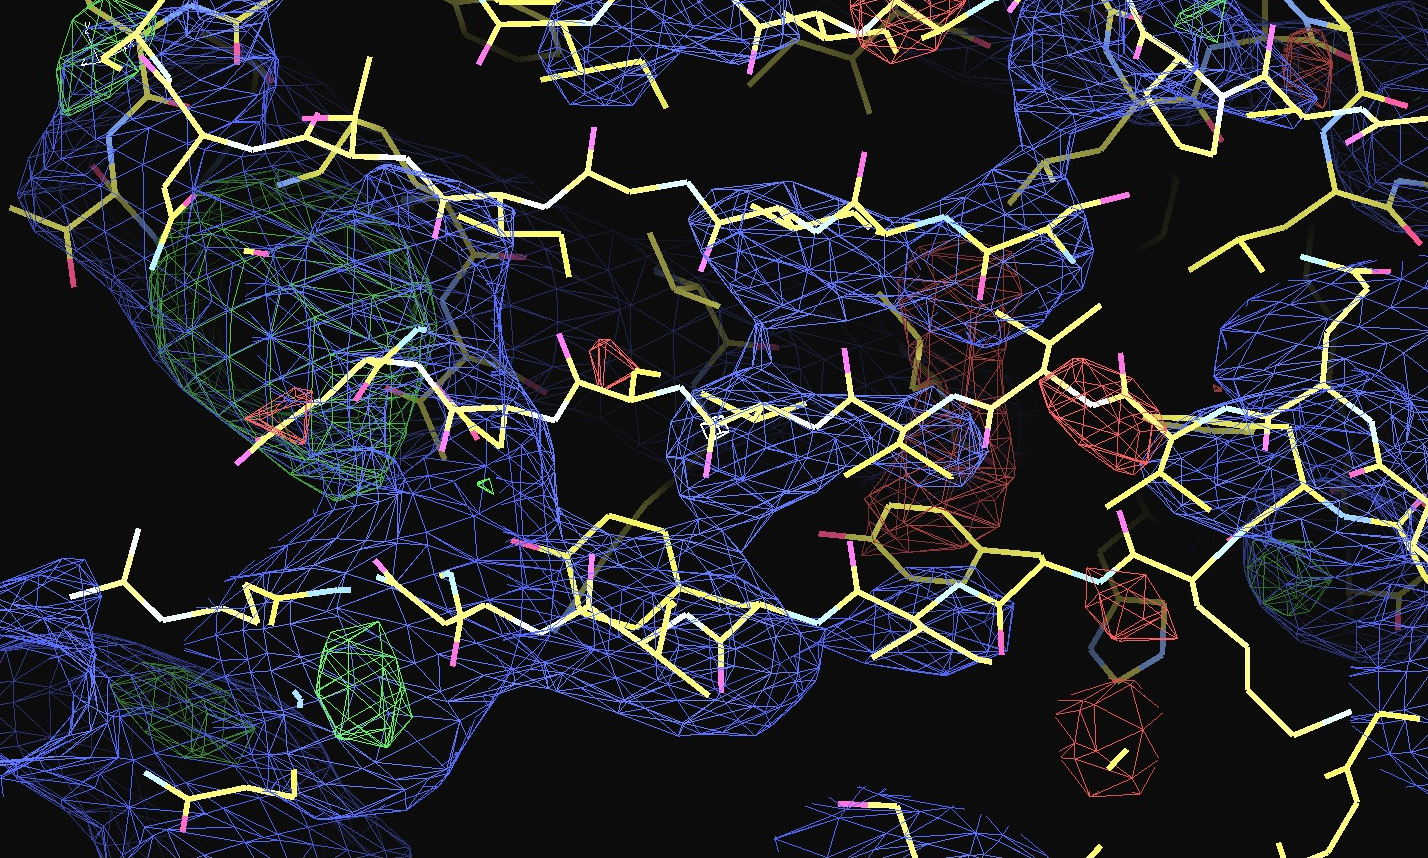
The first pair of images below shows the OpenAstexViewer displays of the intensity data in 3D reciprocal space (the local mean I/σ(I) on the left and the Debye-Waller factor on the right). The other three rows show selected portions of the electron-density map before (left column) and after (right) treatment of the intensity data by STARANISO. Both maps were contoured at 1 RMSD, corresponding to absolute contour levels of 0.0694Å-3 for the original map and 0.0868Å-3 for the map after treatment. The average model Biso values for the refined models are 225Å2 and 160Å2 respectively. The Rwork/Rfree values for the phenix.refine refinements that produced these maps are 0.3292/0.3616 and 0.3101/0.3576 respectively.
Valerie comments: "I hope you can see that the alpha helices now have features and are not just non-descript sausages; bumps can be seen for the phosphates on the DNA backbone, and beta strands have more continuous density. This should all help with refinement".
| 
|
| 
|
| 
|
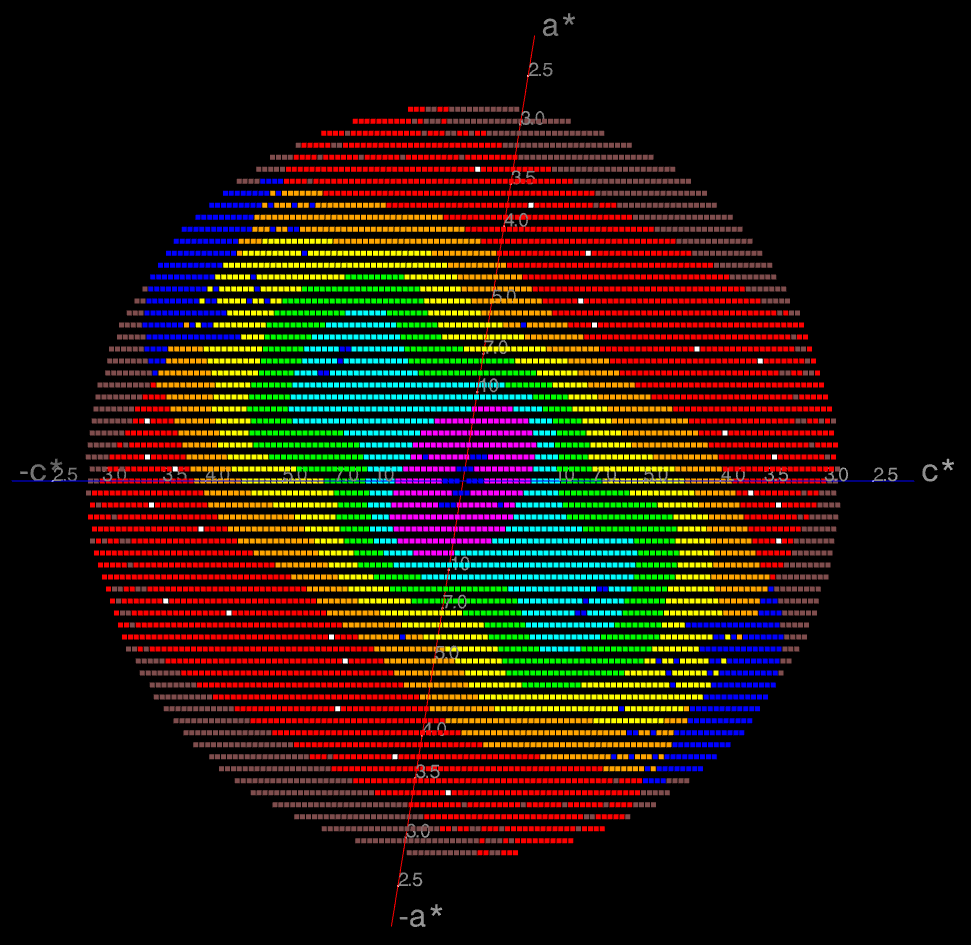 The image on the right shows the OpenAstexViewer display of the
intensity data in 3D reciprocal space. The local mean value of
I/σ(I) for each reciprocal lattice point within the
sphere of observation is calculated by STARANISO and colour-coded: the
blue points represent unobserved data, the red points represent observed data falling below the
1.2σ threshold for cut-off, and the other colours (in increasing
value: orange, yellow, green, cyan, mauve, white) represent successively
higher values of the mean I/σ(I). Incidentally,
it can be seen that there is some truncation of some significant data
(orange points) by the edges of the detector
in the top left and bottom right quadrants.
In this example the (h0l) zone of the diffraction pattern is visible: the space group is C2 in the conventional IUCr monoclinic setting with β nearest to 90o (β = 99o). The data are clearly highly anisotropic with the principal directions of the anisotropy clearly lying along the [-1,0,1], [0,1,0] and [1,0,1] directions. STARANISO deals optimally with this situation by truncating only the red points indicating non-significant data. Unfortunately, some other processing software make the unwarranted assumptions first that the principal directions of the anisotropy coincide with the crystal axes and second that the cut-off surface can be accurately represented by an ellipsoid (note that the principal directions and lengths provide a complete description of the anisotropy only if it is valid to assume that the cut-off surface is a well-defined shape such as an ellipsoid).
The choice of the a and c crystal axes in the monoclinic system is completely arbitrary so there's absolutely no rationale for assuming that the directions of these axes are related in any way to the principal directions of the anisotropy. In this case, because the anisotropy happens to be oriented along the diagonals in the ac plane, the diffraction limits along the crystal axes are 4.2, 3.8 and 3.6Å (i.e. apparently almost isotropic), so that an anisotropic cut-off which only took the diffraction limits along the crystal axes into account would give data with a diffraction limit of 3.6Å in the best direction, i.e. only a marginal improvement on the conventional isotropic cut-off which would give data to ~ 3.8Å. However the diffraction limits along the principal directions are actually 5.0, 3.8 and 2.4Å (latter value is a user estimate), so that the other non-optimal methods of data truncation grossly under- and over-estimate the diffraction limits in the principal directions of the anisotropy.
Note that this is not a problem that is only specific
to monoclinic space groups! In general, the cut-off surface can be
a completely arbitrary 3D shape that is determined not only by the
anisotropy of diffraction but also by the user's choice of
data-collection strategy. This means that the lowest and highest
diffraction limits need not lie either along the principal
directions of the assumed anisotropy ellipsoid, or in the
directions of the crystal axes.
The first pair of images below shows the OpenAstexViewer displays of the intensity data in 3D reciprocal space (the local mean I/σ(I) on the left and the Debye-Waller factor on the right).
|  |
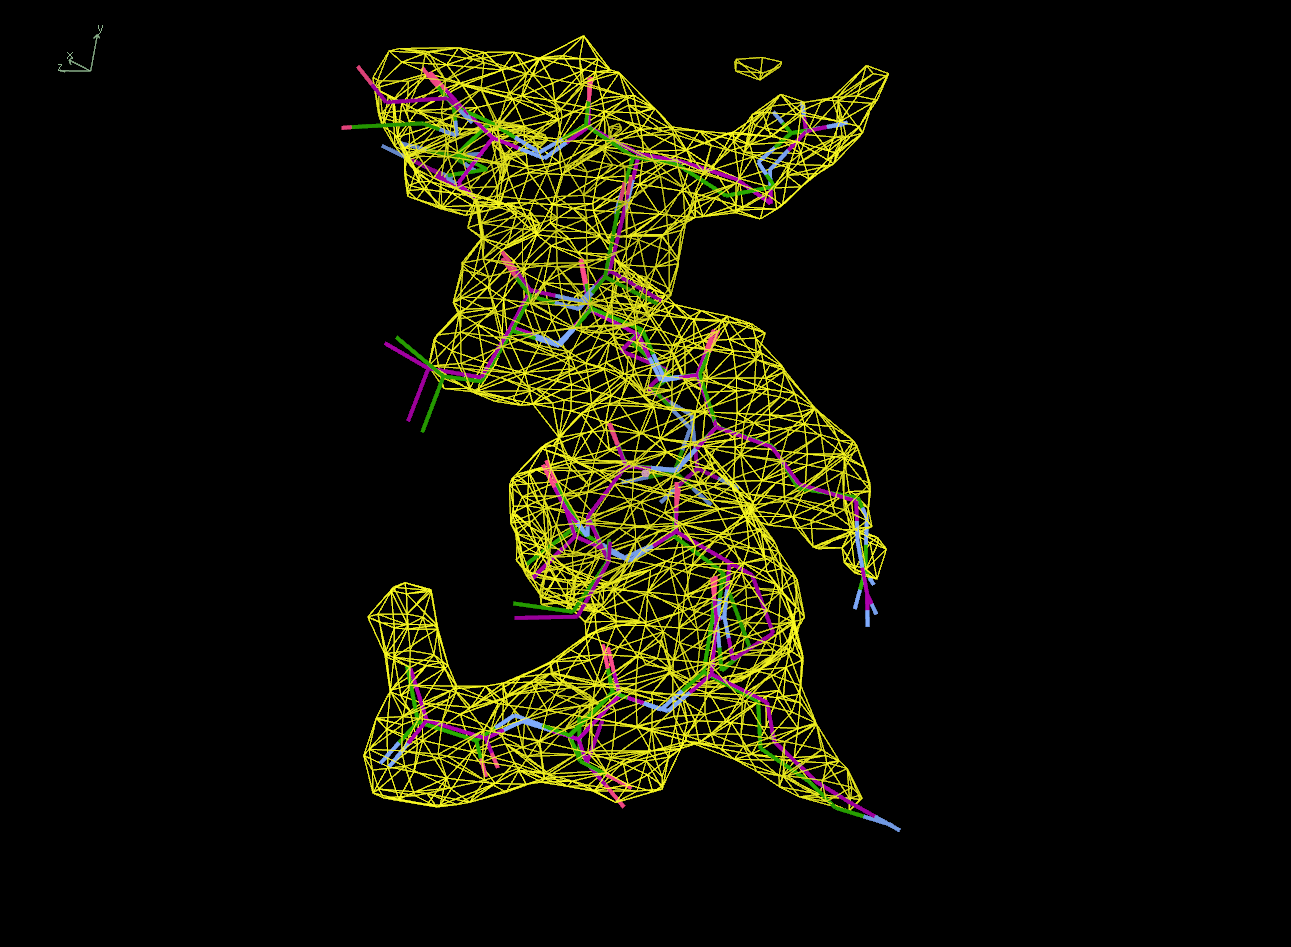
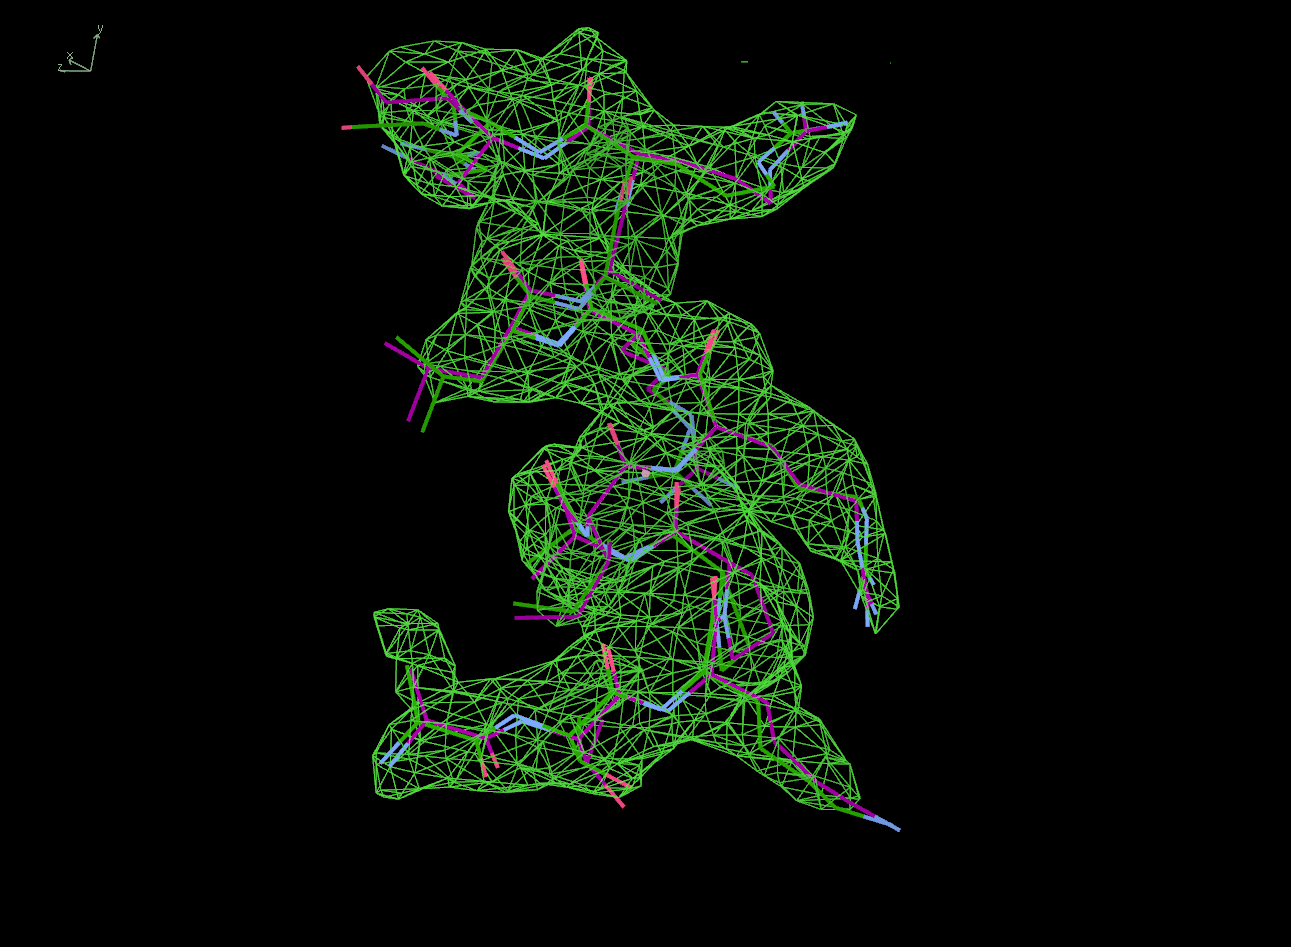
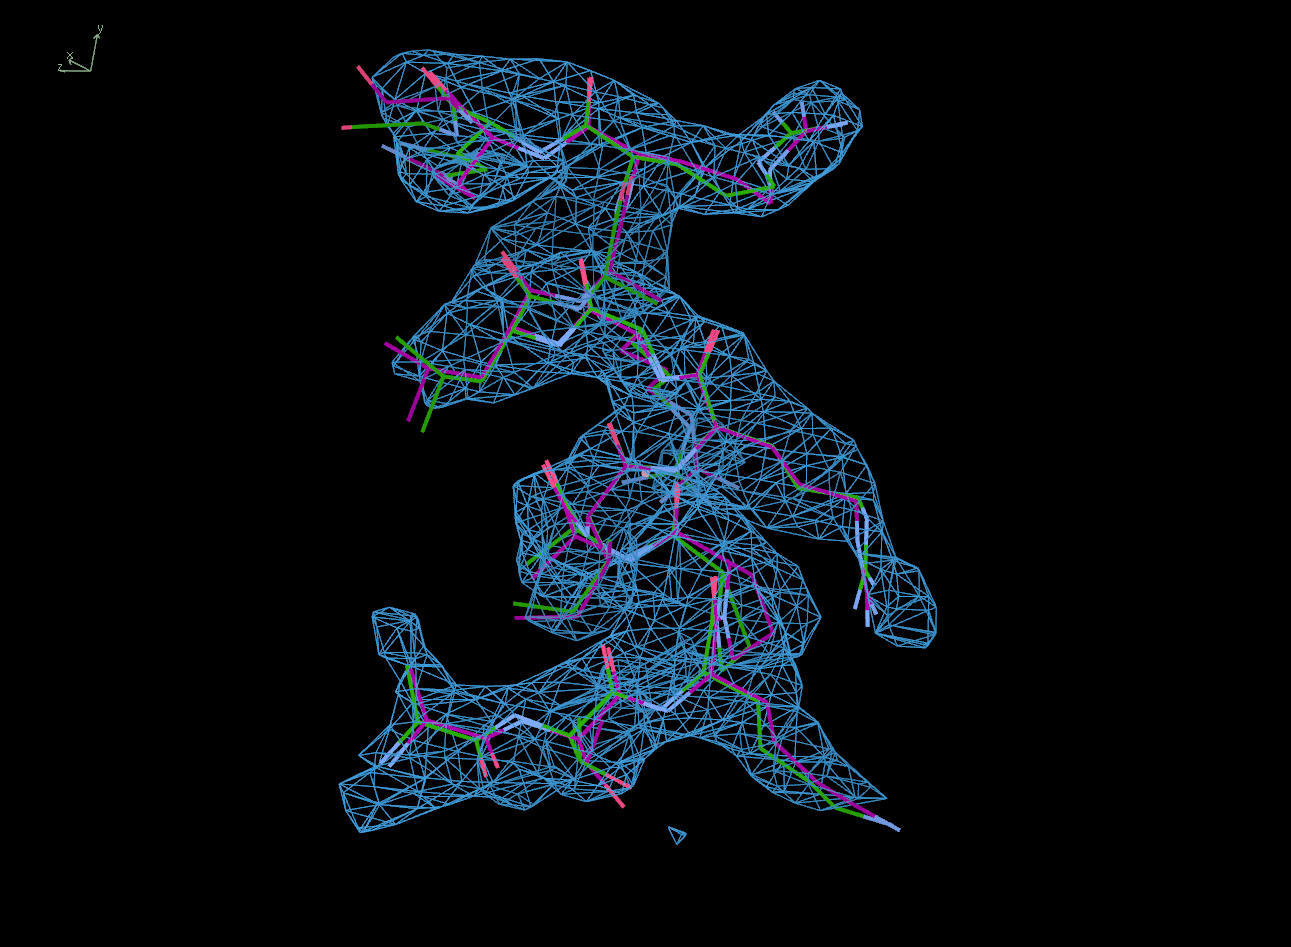
The next row of 3 images shows the model and maps for a helical
peptide ligand (H4) that is an important part of the structure. The
deposited model has its main-chain coloured green, while the
STARANISO/BUSTER-re-refined model main-chain is coloured purple.
The electron-density maps are respectively:
All maps were contoured at 1 RMSD, corresponding to absolute contour levels of 0.130Å-3 (left), 0.124Å-3 (middle) and 0.178Å-3 (right).
Rwork/Rfree are 0.209/0.233 (left), 0.186/0.226 (middle) and 0.182/0.222 (right).
Note the 'BUSTER bonus' going from left to middle, and then the 'STARANISO bonus' going from middle to right.
| 
| 
|
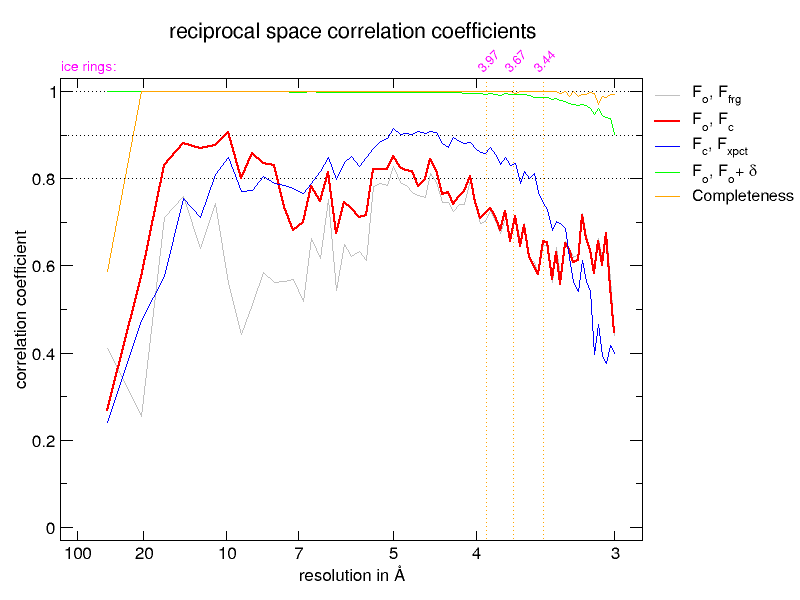
The next pair of images shows the reciprocal-space correlation
plots from the BUSTER refinements, on the left before correction by
STARANISO and on the right, after. Note how at high values of
d* the completeness (yellow) goes down in the 'after' plot but
the fit of the remaining data to the model is much better. Also the
observed correlation (red) and expected correlation (blue) plots agree
much better.
|  |
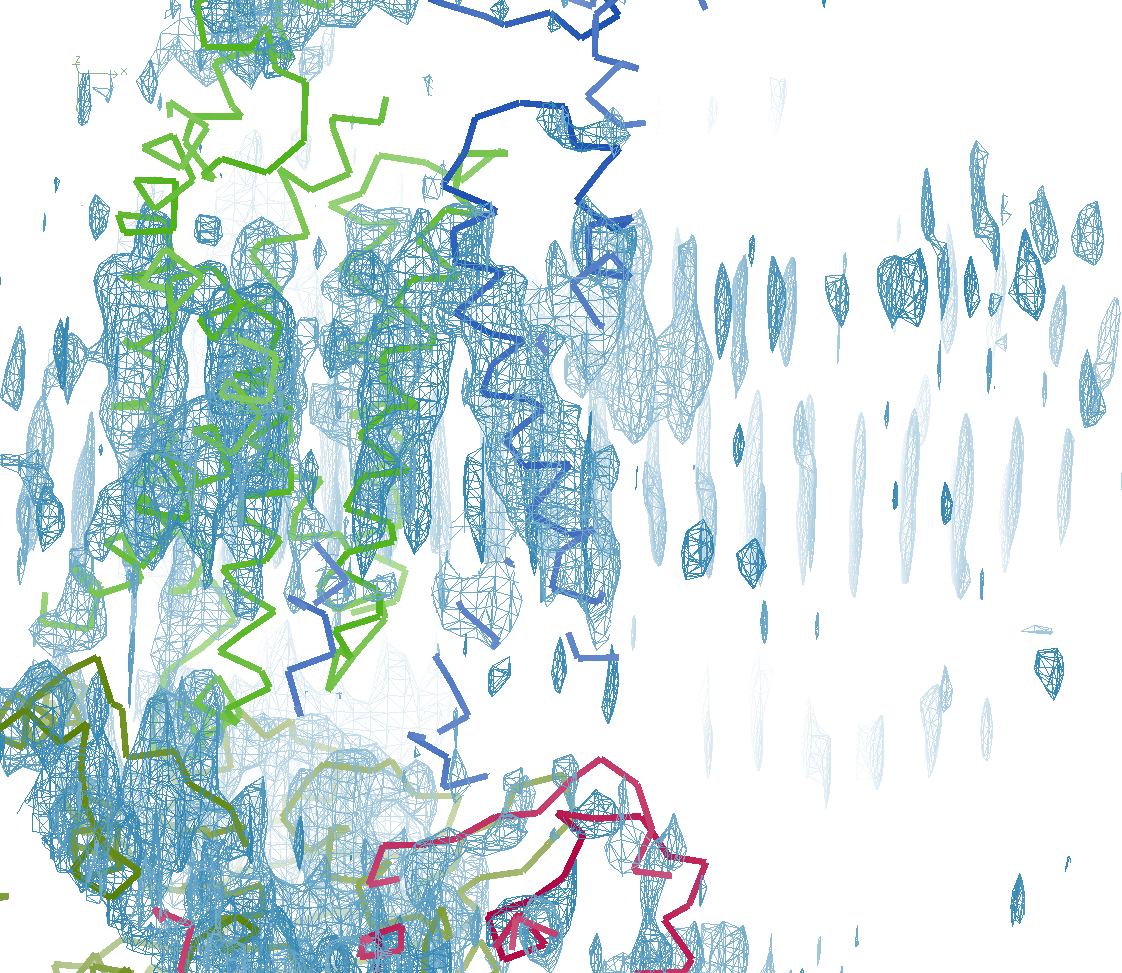
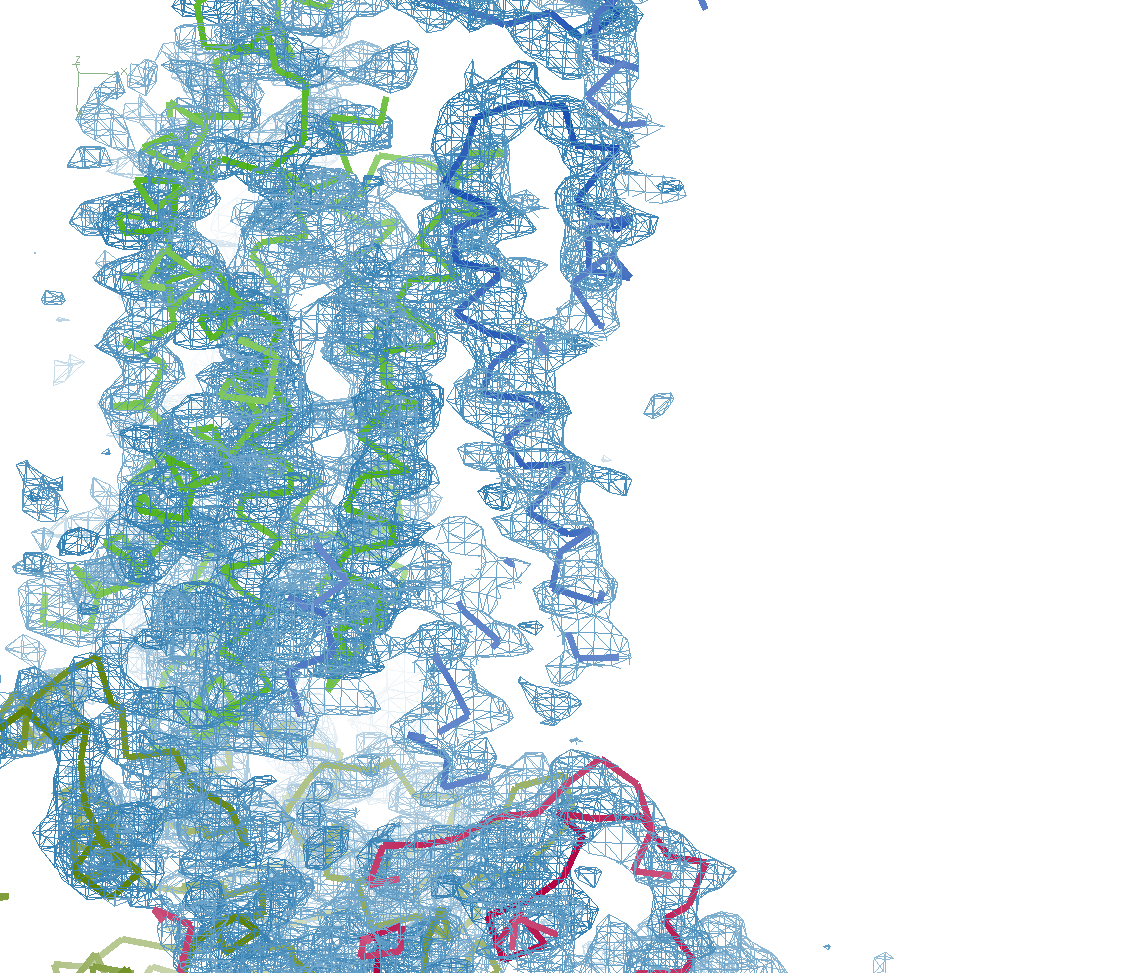
Neil comments: "STARANISO has been key to solving our structure. We’ve got a severely anisotropic case that goes from around 7 Å along a* to 3.0-3.5 Å along b*/c*, with lots of artifacts in the maps. We can find the substructure using Shel-X without correction but the maps are pretty bad; once corrected it works a treat (77% solvent!)."
| 
|
| 
| 
| 
|
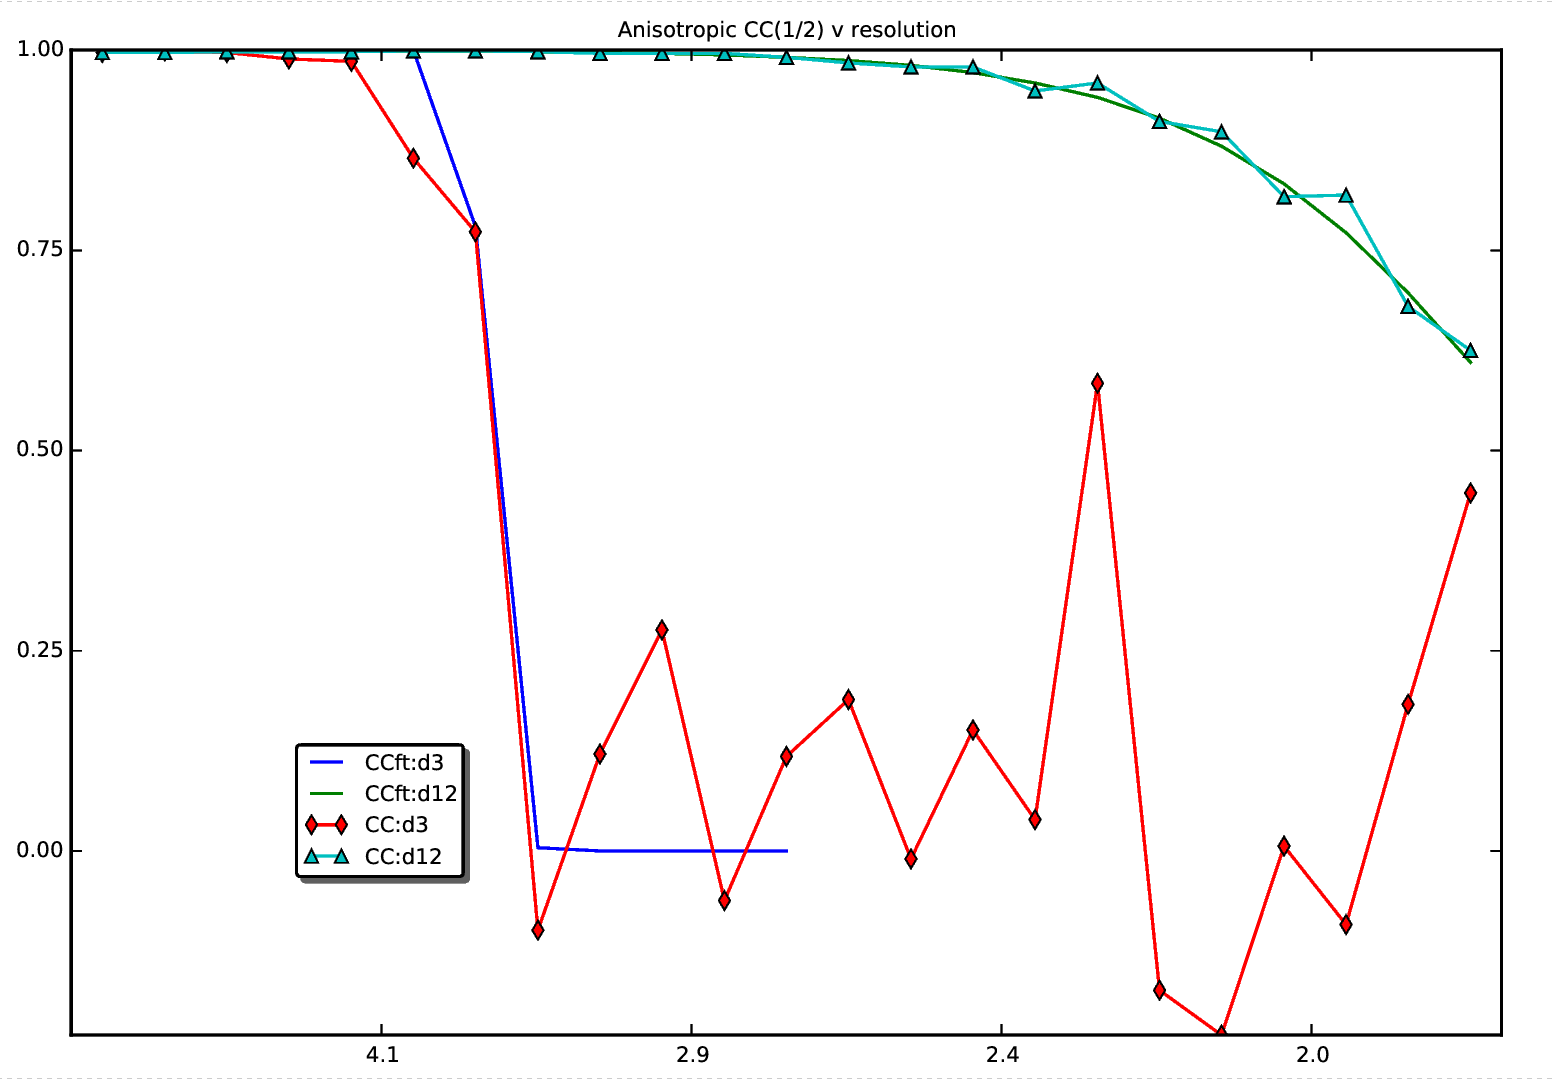
| The CC(1/2) plot relates to the MTZ file used to create the
original map. | |||
| 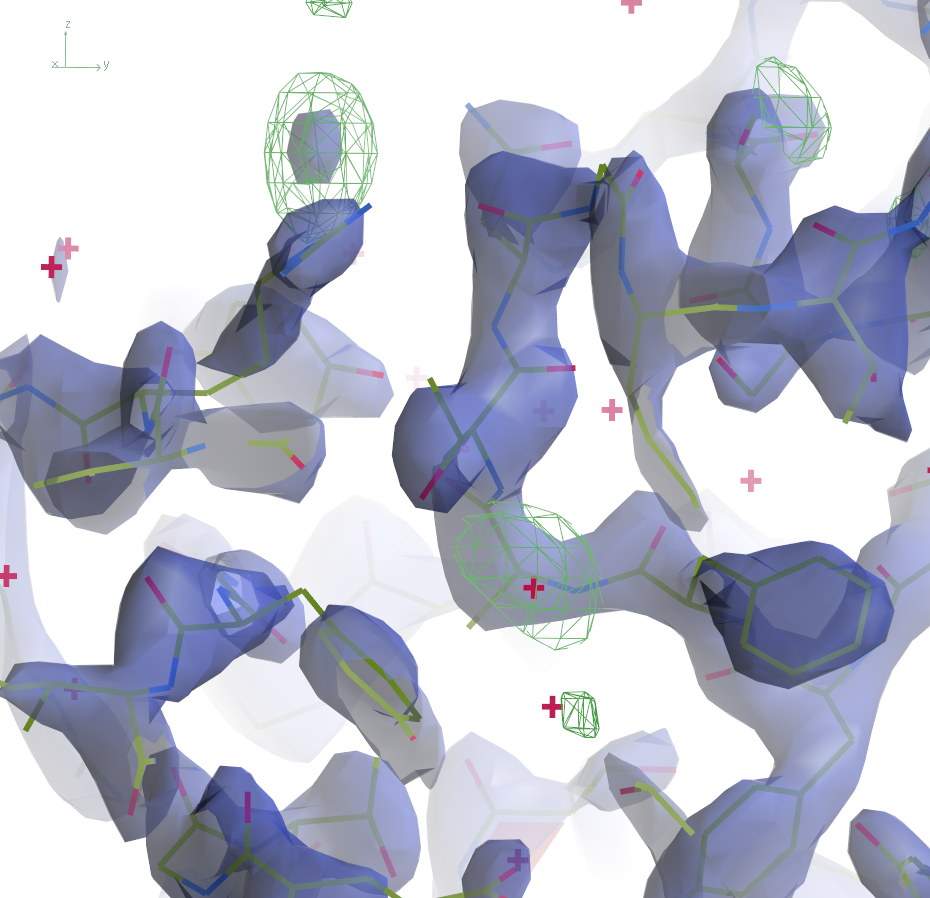 | ||
The 2mFo-DFc maps are contoured at 0.5Å-3 and the
difference maps at 0.25Å-3. Click the images to enlarge.