The STARANISO Server
Anisotropy of the Diffraction Limit
and
Bayesian Estimation of Structure Amplitudes

|
| The STARANISO ServerAnisotropy of the Diffraction Limit
|
|
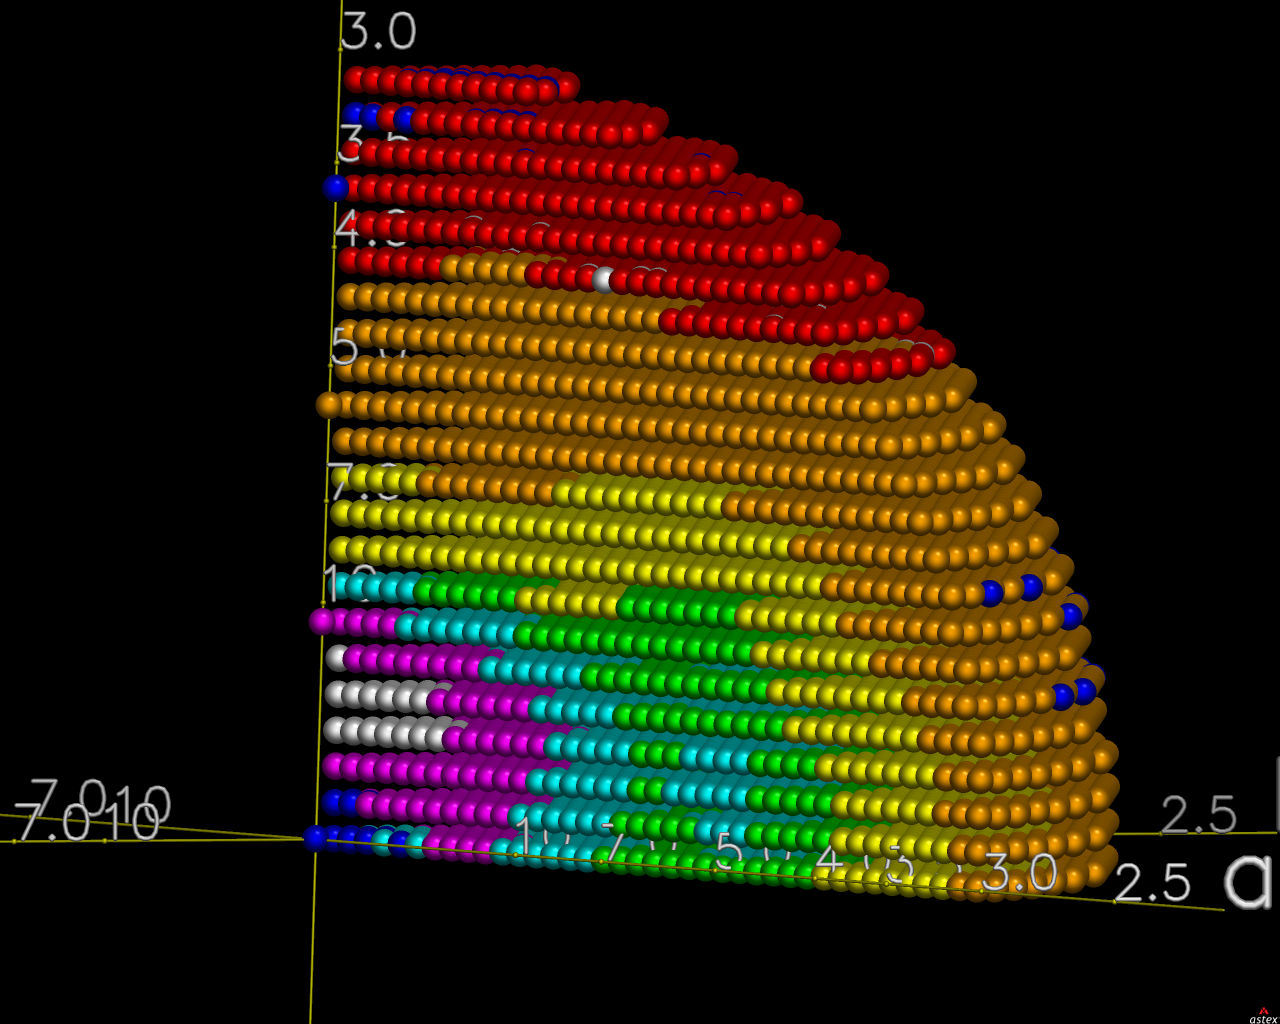
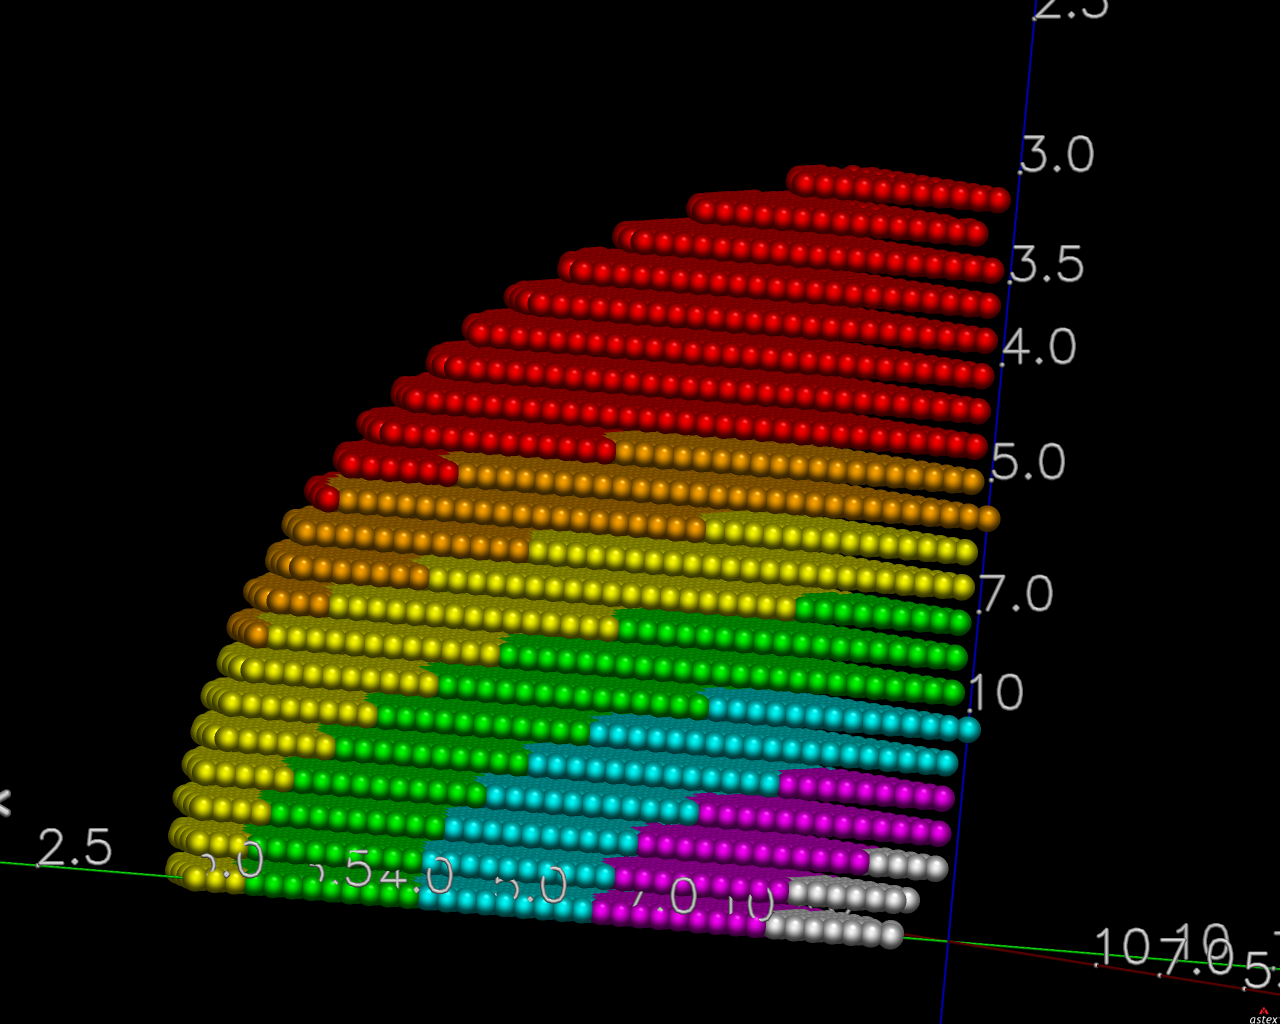
The first pair of images below shows the OpenAstexViewer displays of the intensity data in 3D reciprocal space (the local mean I/σ(I) on the left and the Debye-Waller factor on the right).
|  |
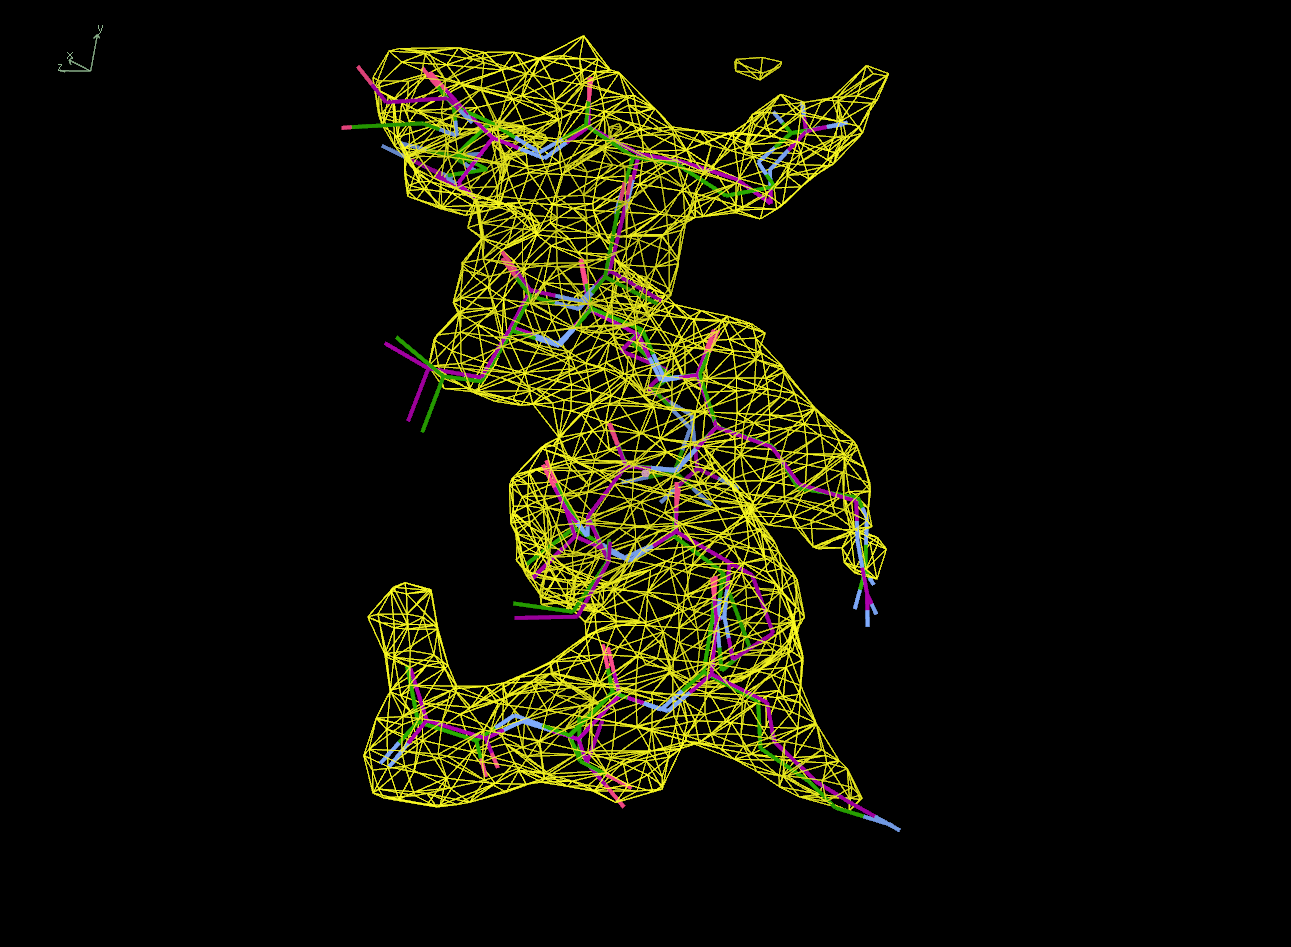
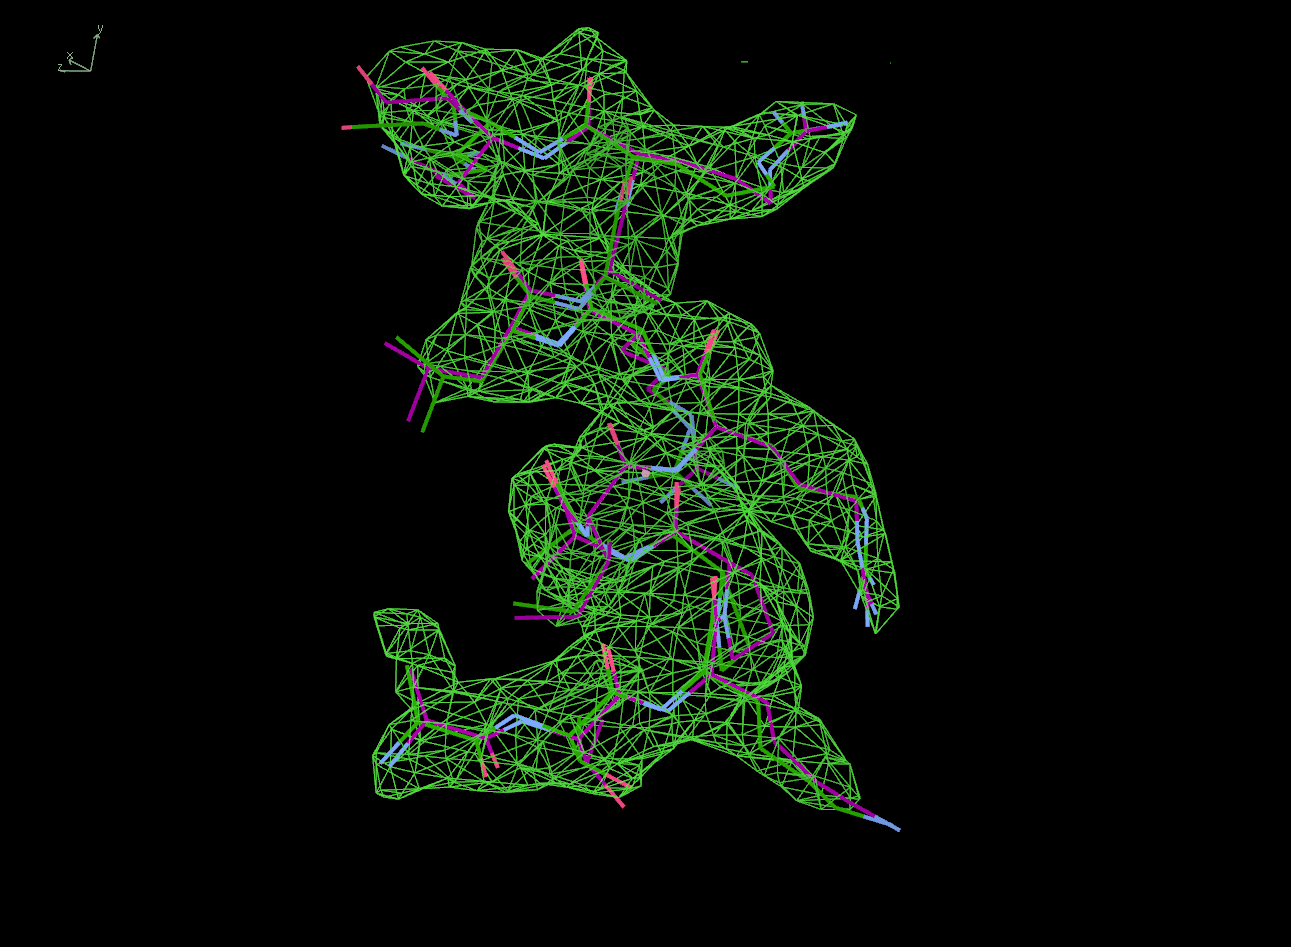
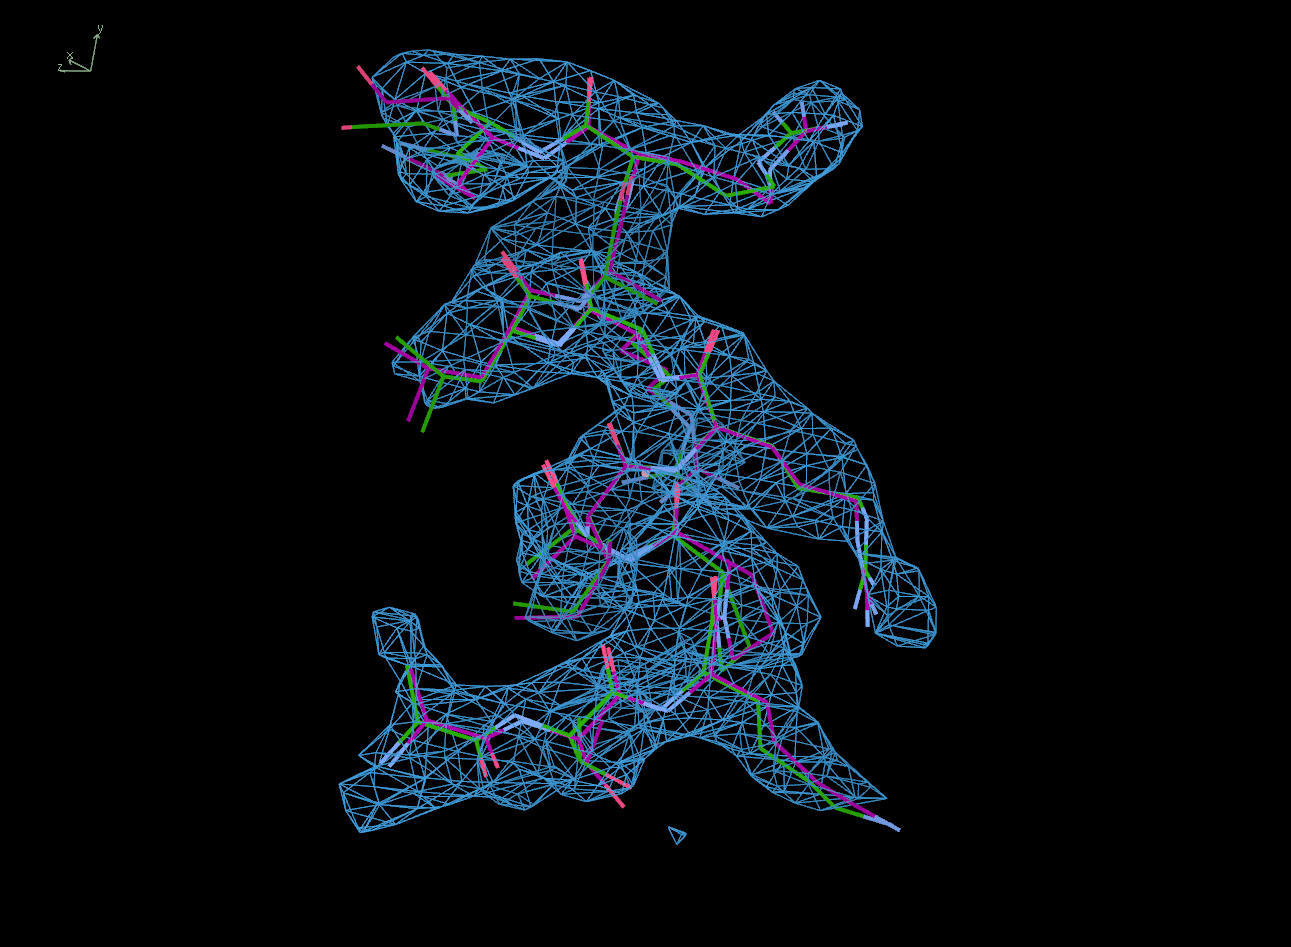
The next row of 3 images shows the model and maps for a helical
peptide ligand (H4) that is an important part of the structure. The
deposited model has its main-chain coloured green, while the
STARANISO/BUSTER-re-refined model main-chain is coloured purple.
The electron-density maps are respectively:
All maps were contoured at 1 RMSD, corresponding to absolute contour levels of 0.130Å-3 (left), 0.124Å-3 (middle) and 0.178Å-3 (right).
Rwork/Rfree are 0.209/0.233 (left), 0.186/0.226 (middle) and 0.182/0.222 (right).
Note the 'BUSTER bonus' going from left to middle, and then the 'STARANISO bonus' going from middle to right.
| 
| 
|
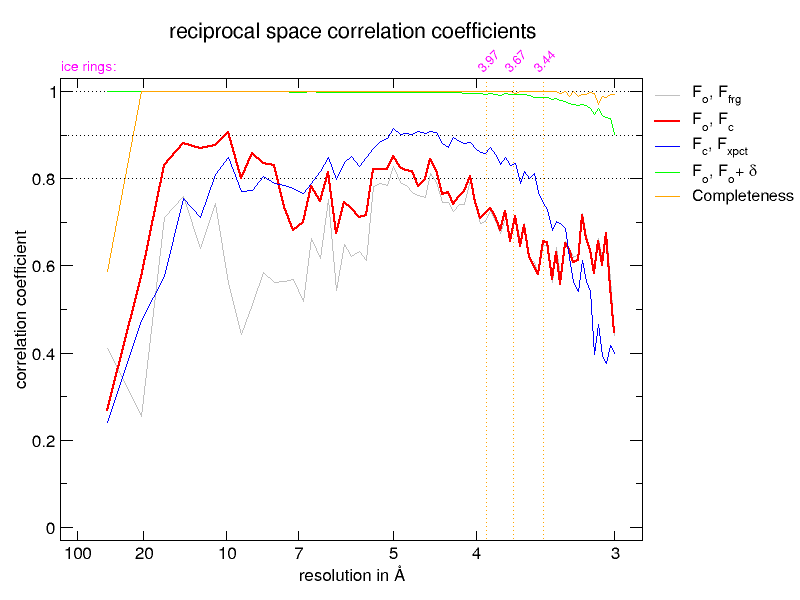
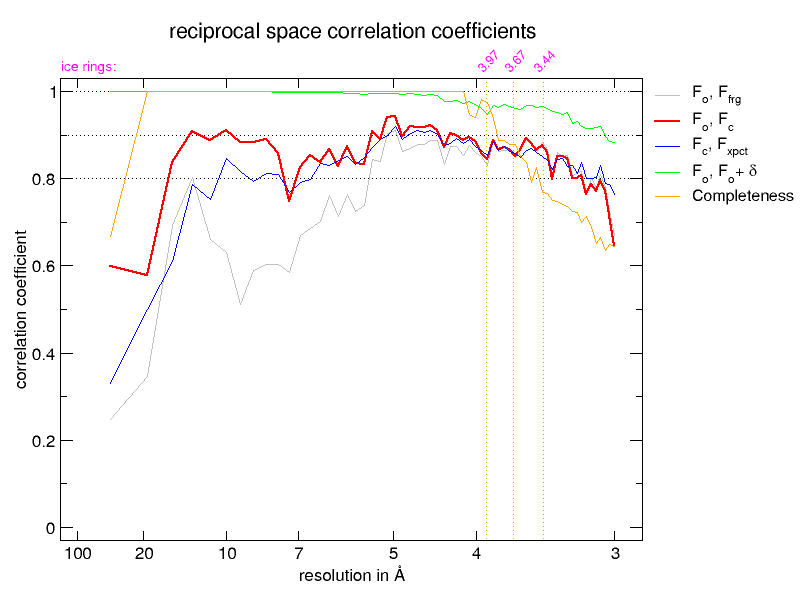
The next pair of images shows the reciprocal-space correlation
plots from the BUSTER refinements, on the left before correction by
STARANISO and on the right, after. Note how at high values of
d* the completeness (yellow) goes down in the 'after' plot but
the fit of the remaining data to the model is much better. Also the
observed correlation (red) and expected correlation (blue) plots agree
much better.
|  |